How to debug RxJS code
A common question from beginners learning RxJS is "how do I debug this?".
The short answer is: you have to depend mostly on drawing diagrams on paper and adding .do(x => console.log(x)) after operators, but it will get a lot better with the arrival of RxJS 5.
Now starts the long answer. Once you have Observables everywhere and RxJS is taking over control flow, the traditional debugger stops being useful. Your application is entirely encoded into Observables, but following the debugger steps becomes confusing the more it crosses the boundary between your code and RxJS library code.
Before blaming RxJS as "not debuggable", let's first put things into perspective. The conventional debugger was engineered for procedural programming, not for any programming paradigm. As long as most of your code is procedural, the conventional debugger will be useful. Code built with RxJS Observables live in a higher level of abstraction than plain procedural JavaScript code. Using the procedural debugger will reveal lower-level details that do not usually help to solve our bugs. The same applies to debugging Promises or callback-based code. Instead of blaming Promises as "not debuggable", we need Promise-specific debugging tools, such as Chrome's Promise Tab in DevTools.
That said, there are 3 techniques you can use today to debug RxJS:
- Adding
.do(x => console.log(x))to trace to the console - Drawing a dependency graph and following the flow
- Drawing a marble diagram
The goal of debugging is simply to help you get an accurate mental model of the execution of your code. These three techniques help you achieve that.
TRACING TO THE CONSOLE
This is the most rudimentary technique: to just "console.log" events happening on the streams.
Given an Observable declaration as such
var shortLowerCaseName$ = name$
  .map(name => name.toLowerCase())
  .filter(name => name.length < 5);
We can add .do(x => console.log(x)) between operators:
var shortLowerCaseName$ = name$
  .map(name => name.toLowerCase())
  .do(x => console.log(x))
  .filter(name => name.length < 5);
Operator do is like a map except it always returns exactly what it was given. The code above is equivalent to
var shortLowerCaseName$ = name$
  .map(name => name.toLowerCase())
  .map(x => {
    console.log(x);
    return x;
  })
  .filter(name => name.length < 5);
This is not the same as subscribing to shortLowerCaseName$:
var shortLowerCaseName$ = name$
  .map(name => name.toLowerCase())
  .filter(name => name.length < 5);

shortLowerCaseName$.subscribe(name => console.log(x));
Because Observables are lazy until you subscribe, a subscription triggers the operator chain to execute. If you have the console.log inside a do and no subscription, the console.log will not happen at all.
So .do(x => console.log(x)) is a non-intrusive tracing technique that does not change the behavior of your program, it simply reflects what actually happens. A subscription is intrusive because it requests the operator chain to execute, changing the behavior of your program, specially if you are trying to debug a hot-or-cold bug.
Notice also that do() is an operator: it returns a new Observable. If you just simply replace subscribe() with do(), nothing will happen because you just got a new Observable as output but you dropped it on the ground:
var shortLowerCaseName$ = name$
  .map(name => name.toLowerCase())
  .filter(name => name.length < 5);

// This console.log will never happen!
shortLowerCaseName$.do(name => console.log(name));
The output from do() must be connected to the operator chain that gets eventually subscribed.
DRAWING DEPENDENCY GRAPHS
Suppose you have RxJS code that looks like this:
var shortLowerCaseName$ = name$
  .map(name => name.toLowerCase())
  .filter(name => name.length < 5);

var bmi$ = weight$.combineLatest(height$, (weight, height) =>
  Math.round(weight / (height * height * 0.0001))
);

var fullInfo$ = shortLowerCaseName$.combineLatest(bmi$);
If you follow the dependencies (e.g. shortLowerCaseName$ depends on name$) and build the dependency graph, you get:
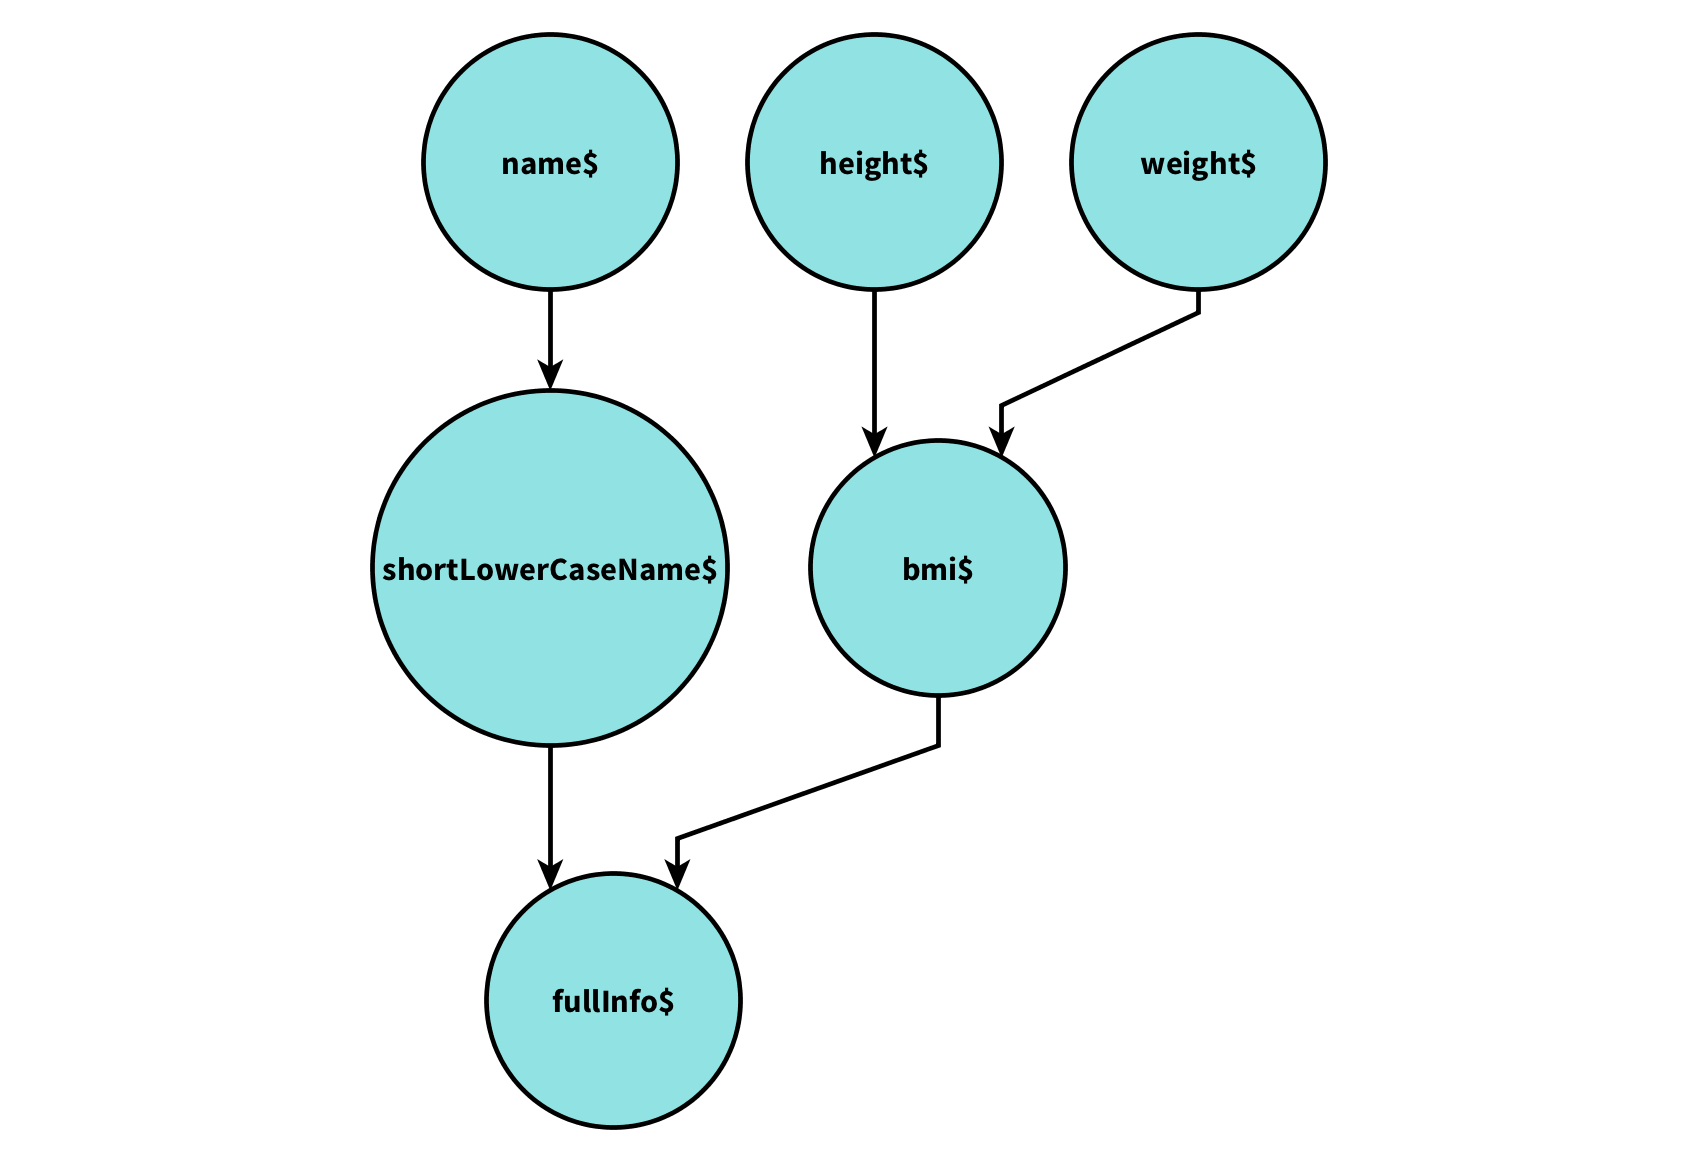
This can be easily drawn just by statically analyzing your code. Each circle is an Observable, and each declaration var b$ = a$.flatMap(...) represents an arrow a$ --> b$.
Observable dependency graphs should be the first tool you use to detect where does a bug live. They are useful to give an overview of your RxJS code.
Once you have the dependency graph drawn on paper, you can add .do(x => console.log(x)) on key locations, for instance after every Observable declaration. Then, when executing code you will get a log that tells you how code flowed through the dependency graph.
Always be aware that Observables in the dependency graph are either cold or hot. For instance, specially in cases where a$ has two outgoing arrows, say a$ --> b$ and a$ --> c$, probably a$ should have .share() to make it hot for b$ and c$. Sometimes, though, a$ needs to be cold, but it's important to take a conscious decision whether it should be cold or hot.
Usually the dependency graph is enough to point out which part of the dataflow is not working as you expected it to. Then, you can zoom into a specific Observable and use a marble diagram to debug it.
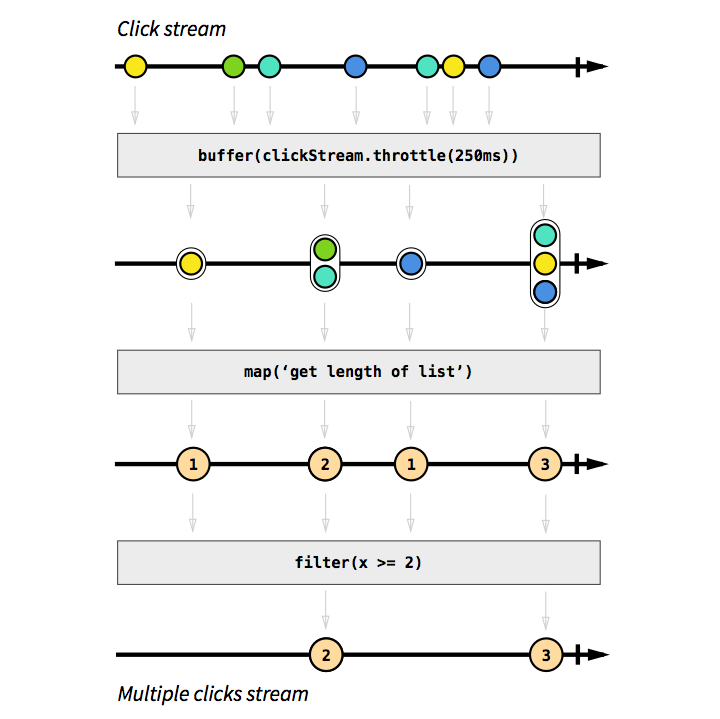
DRAWING MARBLE DIAGRAMS
Most basic RxJS operators have marble diagrams [1] [2]. A marble diagram expresses how an operator works by displaying its input Observable (an arrow with dots, at the top) and output Observable (an arrow with dots, at the bottom) behaving over time. Because an operator is just a function that returns a new Observable, you can also draw marble diagrams for any function you write which takes Observables as input and outputs Observables.
If you are unsure how an operator (or a sequence of operators) works, add .do(x => console.log(x)) before and after the operator, execute the code, draw the marble diagram on pen and paper, and soon enough you know how that operator works. Use RxMarbles to drag marbles and see how basic operators create output Observables.
THE FUTURE
As hinted in the introduction, the procedural debugger is rather useless for debugging RxJS code, and you might have seen huge stack traces full of functions from the RxJS library.
It will get a lot better with the next version of RxJS. Stack traces will become much shorter, making using the procedural debugger actually bearable to inspect RxJS code. This will be specially useful when profiling slow JavaScript code.
However, as hinted, like Promises deserve their own dedicated debugger, also RxJS Observables can have a dedicated debugger. The new Lift-based architecture in RxJS 5 makes it possible and easy to inject behaviors into all observers in an operator chain. Ben Lesh at Netflix has mentioned future plans for building a debugging tool for Observables based on lift().
In the near future, we may see real-time rendering of the dependency graph or real-time rendering of marble diagrams. The former is made possible with static analysis or the Lift architecture.
Marble diagrams (in text format) are used extensively in RxJS 5 for unit tests, such as this case:
it.asDiagram('debounce')('should debounce events', () => {
  var e1 =   hot('-a--bc--d---|');
  var e2 =  cold( '--|         ');
  var expected = '---a---c--d-|';
  var result = e1.debounce(() => e2);
  expectObservable(result).toBe(expected);
});
These text-based marble diagrams can already be used by RxJS 5 users. Also, their correspondent PNG diagrams can be automatically generated too. The PNG diagram for the test case above is:
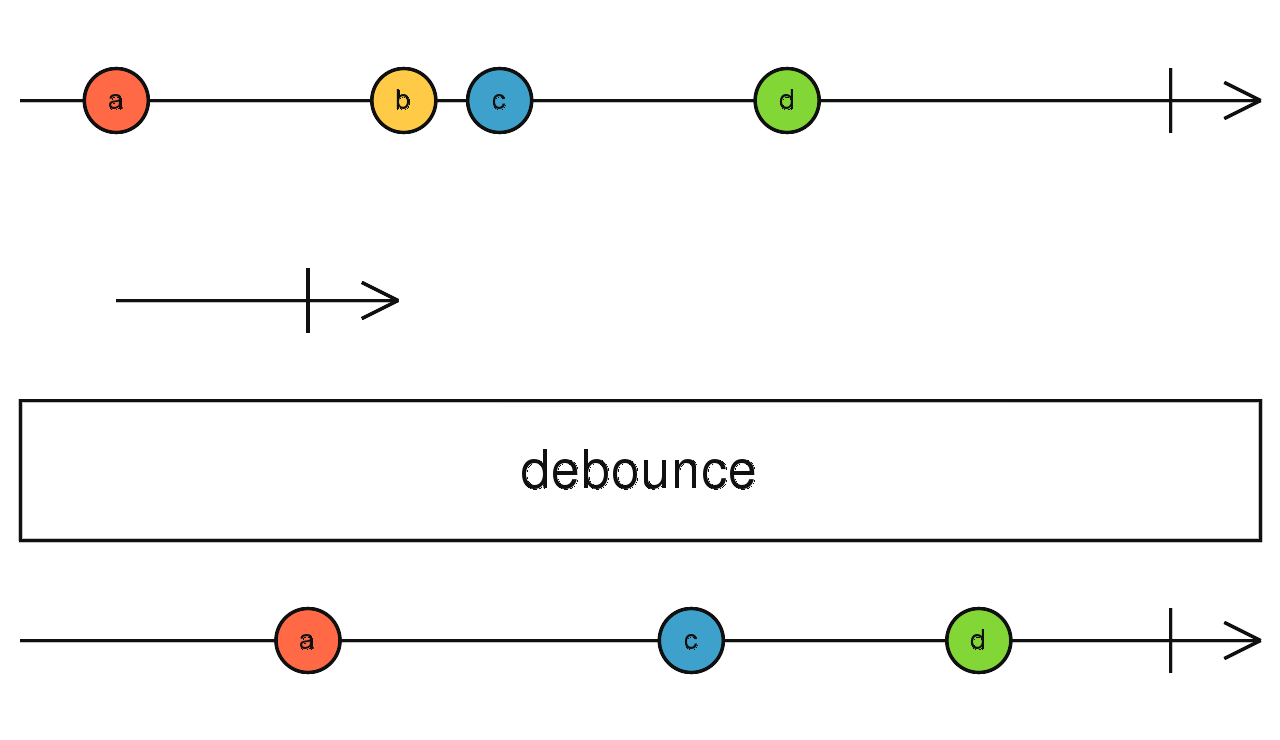
Automatic static generation of these marble diagrams is a first step towards real-time rendering.
RxJS debugging tools are still weak, but a lot of effort is happening as we speak to get strong tools appropriate for Observables.
LESSONS LEARNED
- First, draw the dependency graph.
- Observables with two or more outgoing arrows in the dependency graph usually need to be hot.
- To debug with the console log, use
.do(), not.subscribe(). - Draw a marble diagram if you need to debug a particular operator or a short sequence of operators.
If you found this useful, you can support my writing on Patreon.